Accessing system-wide analytics
To access reports that involve data from other campuses you must log into the Network Zone and access analytics reports from there. The NZ is accessed via a different link and set of credentials than your institutional Alma.
If you do not have a user account set up in the NZ contact Mallory or Brandon at the CO to set one up for you.
Saved system-wide reports
Log into the NZ and open analytics.
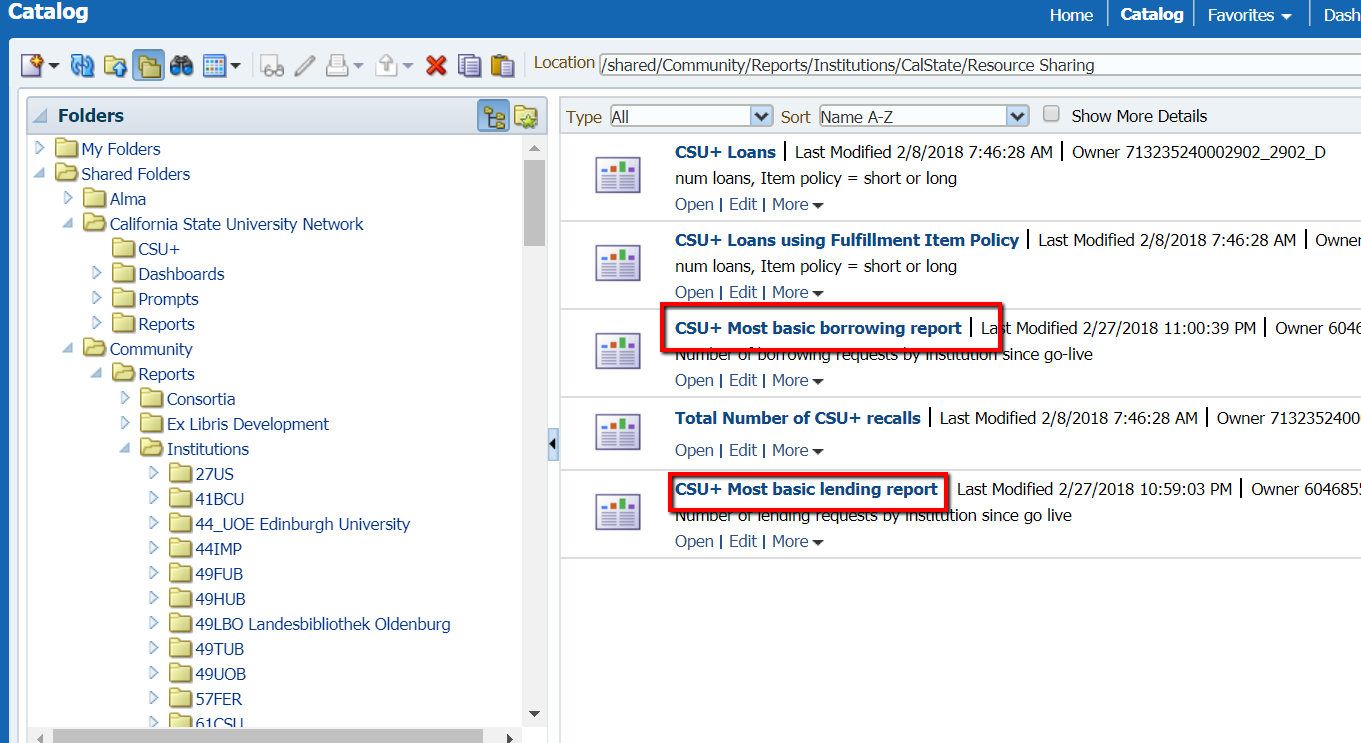
Navigate to Shared Folders > California State University Network > CSU+. There you will find two saved reports that measure overall CSU+ lending and borrowing:
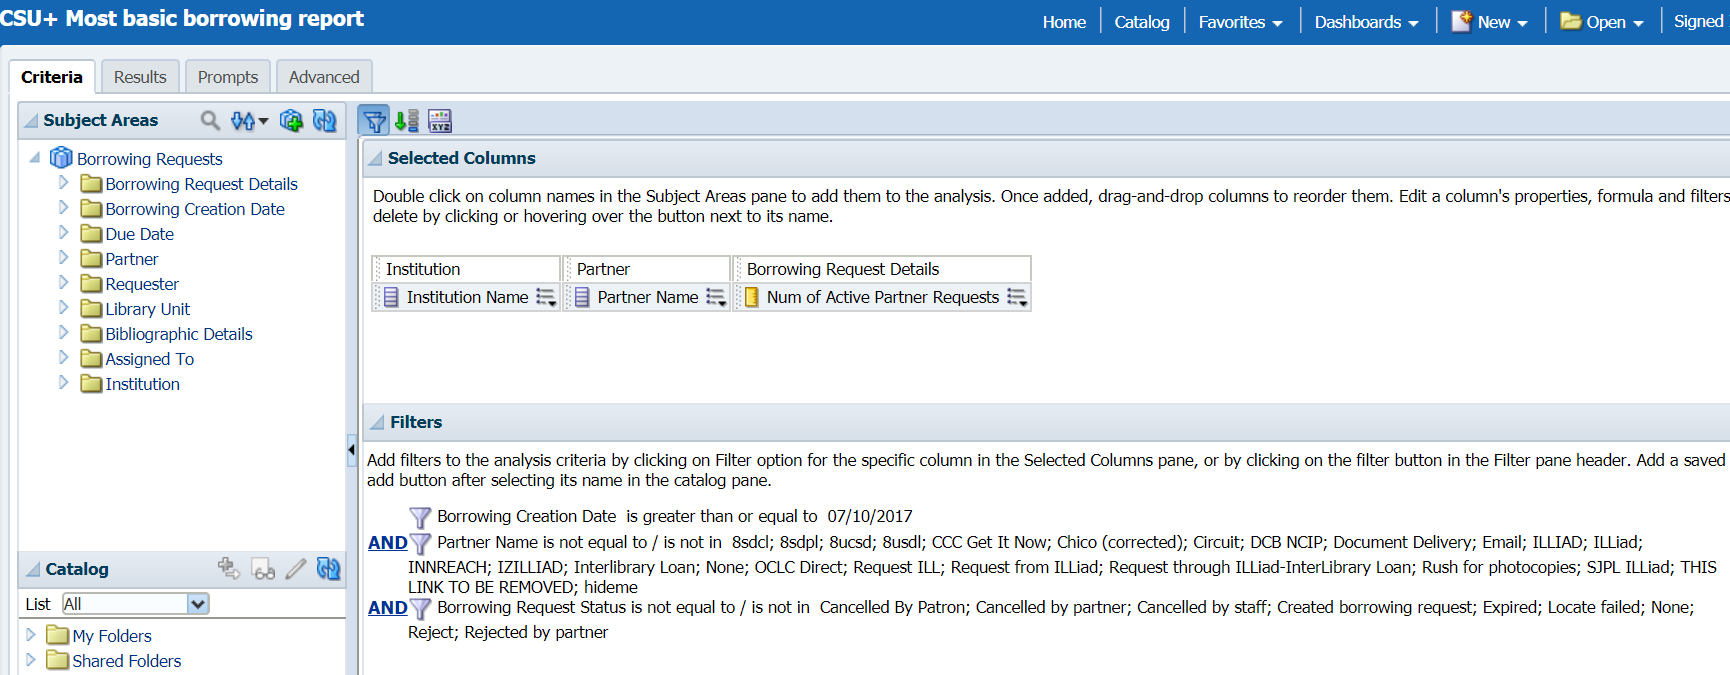
CSU+ Most Basic Borrowing Report
Simple measure of the volume of items borrowed by each institution sorted by where they borrowed the item from since go-live
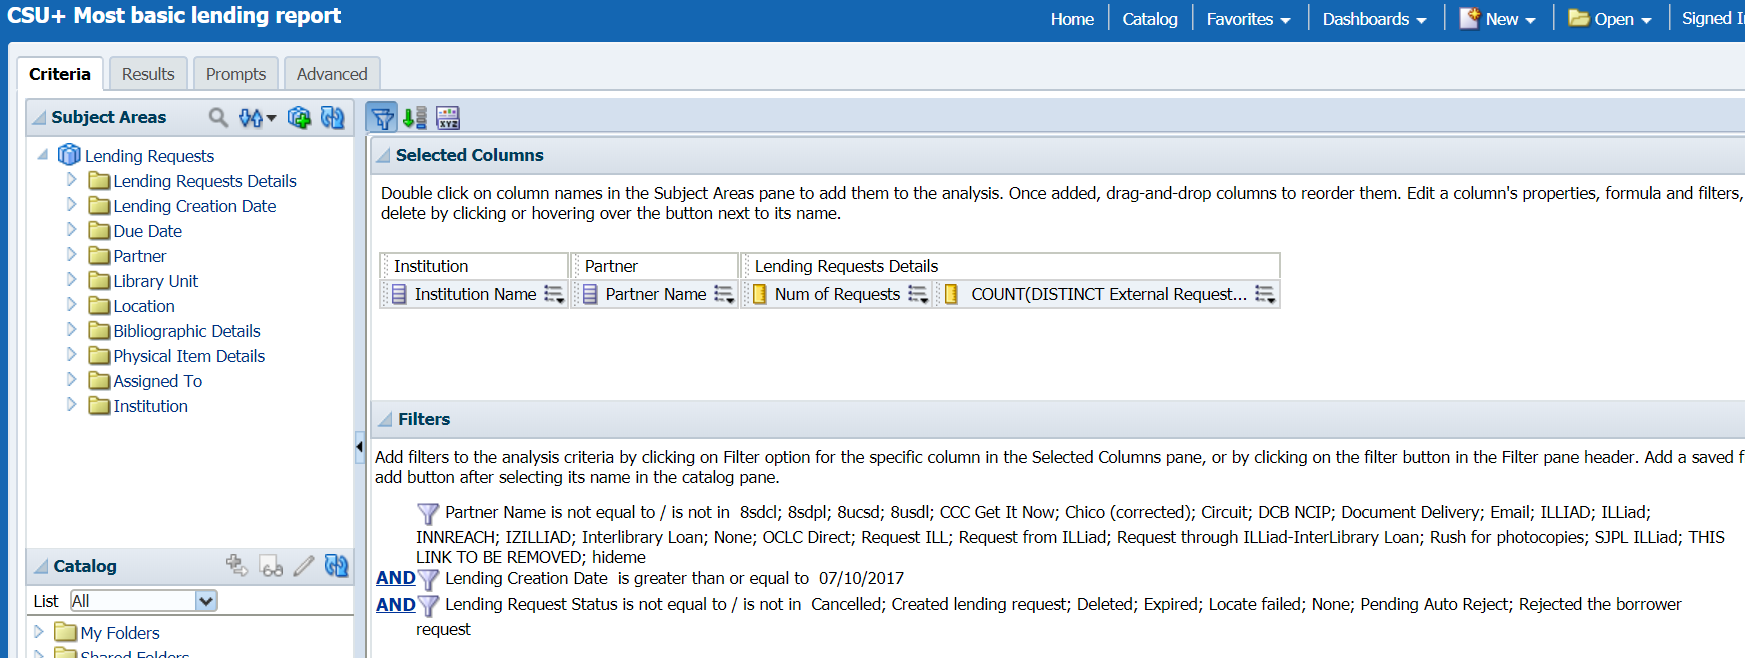
CSU+ Most Basic Lending Report
- Simple measure of the volume of items lent by each institution sorted by who they lent the item to since go-live
To run these reports in your own institution
Find a copy of these reports in the CalState Resource Sharing folder in the community folders: /shared/Community/Reports/Institutions/CalState/Resource Sharing. Or search for "CSU+ most basic" to pull up the reports quickly.
Simply open them and they will reflect the report with all the applicable filters with your own institution's data. I recommend you save a copy of this report (remember to SAVE AS or copy and paste!) and use it as a base for other reports you create in the future so you don't have to apply the same filters from scratch every time.
When crafting CSU+ reports in your own institution
Make sure to do the following:
- Make sure your filter operators are consistent between borrowing and lending reports. So if you filter your partners or statuses by the "Is not equal to" parameter in your borrowing reports make sure you're also using "Is not equal to" in your lending reports.
- Filter the borrowing or lending creation date by greater than or equal to 7/10/17 - our CSU+ go-live date.
- Filter partners to exclude anything except CSU campuses (so remove partners like Document Delivery, ILLiad, etc).
- Unless you are measuring fill rates or some other function that requires capturing the number of unfilled requests filter out borrowing statuses like Cancelled by patron, Rejected by partner, Cancelled by staff, etc.
- If you don't want to actually use the above parameters in your report (partners, date, status) you can delete the column from the report while retaining the filter.
A note about borrowing reports
Use the measure "Num of Active Partner Requests" to see the requests actually sent out to be filled. Active Partner Requests will record one request for a borrowing request that's actually sent out to another institution to be filled.
- The more intuitive seeming option "Num of Requests" measures possible requests. So it will show one "request" for every institution in the CSU that has the item available for resource sharing. It is essentially the same thing as "Num of Partners in the Rota (Total)".
If your numbers start to look unusual
If you start to see weirdness in your numbers that is not explained by double checking your filters and you want a sanity check create a measure to count the number of External Identifiers in your analysis. External Identifiers are rarely duplicated and can function as a nice substitute for measuring the volume of items sent back and forth. To create this measurement:
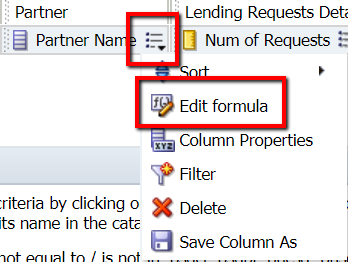
Drag in any measure from the left side (it doesn't matter what it is because you'll be editing it manually to become what you want). Click on the icon that looks like bullet points to see the menu of options and pick "Edit formula"
For borrowing: paste in COUNT(DISTINCT "Borrowing Requests Details"."External Identifier")
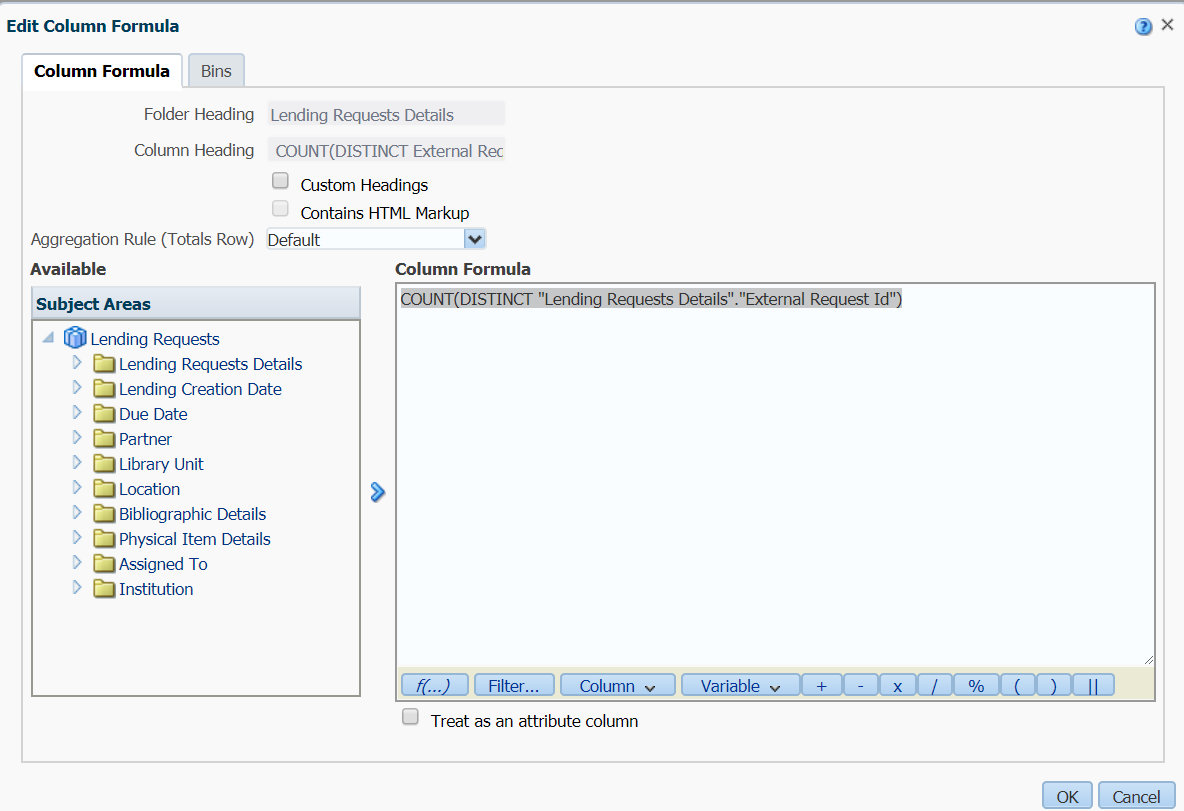
For lending: paste in COUNT(DISTINCT "Lending Requests Details"."External Request Id")
So it looks like this:
Then click OK and your sanity-checking column has been created.
System-wide borrowing and lending numbers dated 2/27/18
Below find a link to a spreadsheet that captures the borrowing and lending statistics as of 2/27/18. There are two tabs on the sheet - one for borrowing and one for lending. You'll find that there is a slight discrepancy between the borrowing and lending totals. This may be due to requests not being totally in sync at the time of data harvesting and slight differences in the borrowing/lending creation dates. There may be other factors that contribute to the difference that we are as yet unaware of.
This spreadsheet also includes the Lending:Borrowing ratio, which the shared Alma reports above do not. These ratios were manually added in excel after export. At this time we are not able to combine the two types of reports and add the necessary filters to the data.
The Resource Sharing Committee will be putting together instructional material to help ILL staff become comfortable enough with using analytics so they can pull their own statistics from Alma on demand instead of relying on numbers regularly posted by a third party.

